Add R Plots to LaTeX Documents
Here I am showing how to go from data stored in csv file to a nice plot in a LaTeX document using ggplot2 package from R.
My goal was:
- Import csv file with data
- Create a plot in R
- Make this plot available in LaTeX document
Prerequisites
- LaTeX is installed –
sudo apt-get install texlive-full - R is installed –
sudo apt-get install r-base
Configuring R
get to R console with R
> install.packages("tikzDevice", "ggplot2")
Making a Plot and Saving it as LaTeX File
Assuming I have a csv file like this:
parser,threads,mph
gnparser,1,21.4
gnparser,2,41.1
gnparser,4,73.8
gnparser,8,89.3
gnparser,12,93.8
gbif,1,23.0
gbif,2,45.5
gbif,4,76.3
gbif,8,111.5
gbif,12,114.6
biodiv,1,4.0
biodiv,2,6.2
biodiv,4,9.2
biodiv,8,10.0
biodiv,12,9.1
These data show parsing millions of names per hour, but in the plot I need data of names parsed per second
plot.R file:
#!/usr/bin/env Rscript

require(ggplot2)
require(tikzDevice)

data <- read.csv("plot.csv")

nps <- function(d) { d * 1000000 / 3600 }

tikz("../../throughput.tex",width=5,height=5)

ggplot(data=data, aes(x=threads, y=nps(mph),
       group=parser, shape=parser)) +
  geom_line(size=0.5) + geom_point(size=3) +
  xlab("CPU Threads") + ylab("Names/Second") +
  scale_shape_discrete(name="Parser",
                       breaks=c("gnparser","biodiversity","gbif-parser")) +
  scale_x_discrete(breaks=seq(0,13,2)) +
  theme(
      legend.key = element_rect(fill = "white"),
      legend.background = element_rect(fill = "white", color="black", size=0.3),
      legend.position = c(0.8,0.35),
      panel.grid.major = element_line(colour = "white"),
      axis.line = element_line(colour = "black"),
      axis.ticks = element_line(colour = "black"),
      axis.text = element_text(colour = "black", size = 10),
      panel.grid.minor = element_blank(),
      panel.background = element_rect(fill = "white")
    )
dev.off()
Update (2020-10-07): I received a feedback that dev.off() is not needed now. More info can be found in this StackOverflow Question
Note the height and width parameters for tikz() function – they were
needed to scale the plot down. After the file is created it can be included
into a LaTeX document:
...
\usepackage{tikz}
...
\begin{figure}[htbp]
\begin{center}
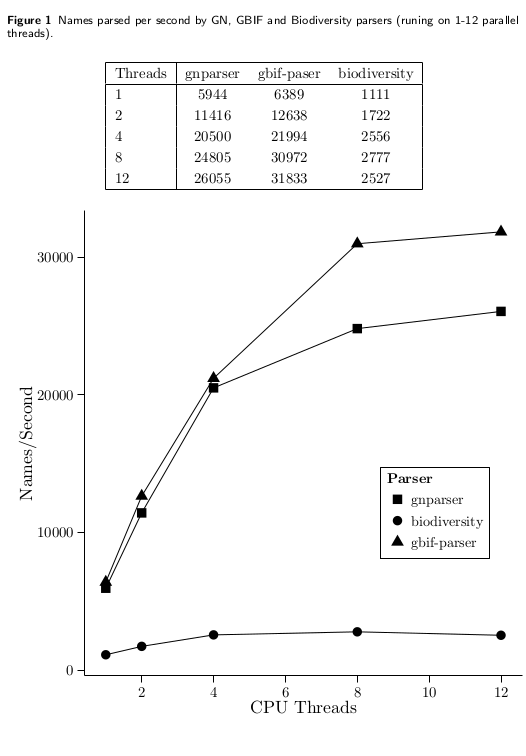
\caption{Names parsed per second by GN, GBIF and Biodiversity parsers (runing on 1-12 parallel threads).
}\label{figure:throughput}
\include{throughput}
\end{center}
\end{figure}